If you're buying or selling an apartment building in Los Angeles, the cap rate is probably the first number that comes up in any conversation. It's the most common metric for valuing commercial real estate, and in a market as competitive as LA, understanding what drives cap rates up or down can mean the difference between a smart deal and an expensive mistake.
But here's the thing most people get wrong: a low cap rate doesn't automatically mean a bad deal, and a high cap rate doesn't automatically mean a good one. Context is everything, especially in a rent-controlled market.
The capitalization rate is straightforward on the surface. You take the property's Net Operating Income and divide it by the purchase price (or current market value). NOI is your gross rental income minus operating expenses like property taxes, insurance, maintenance, utilities, and management fees. It does not include debt service or capital expenditures.
So if a building generates $200,000 in NOI and you buy it for $4 million, that's a 5% cap rate. Simple enough.
Where it gets complicated is in how you calculate NOI. Are you using actual current rents or pro forma market rents? Are you accounting for vacancy? What expense ratio are you assuming? In LA's multifamily market, I see buyers and sellers disagree on NOI calculations more than almost anything else.
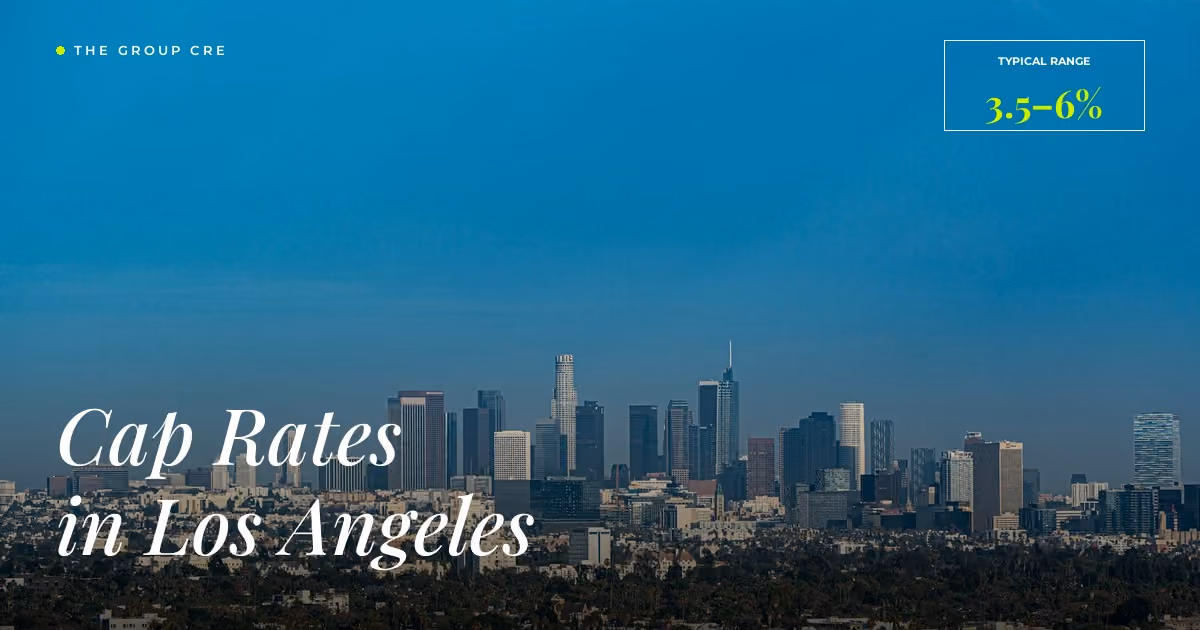
LA is not a single market. Cap rates vary dramatically depending on where the building sits, and these ranges shift quarter to quarter based on interest rates, inventory levels, and investor demand.
Westside premium markets like Beverly Hills, Century City, Brentwood, and Santa Monica consistently trade at the lowest cap rates in the city, typically 3.5% to 4.5%. Buyers here are paying for location stability, high-quality tenant bases, and strong long-term appreciation. These are trophy assets.
Mid-city and urban core areas including Koreatown, Hollywood, East Hollywood, Silver Lake, and Echo Park generally see cap rates between 4% and 5%. These neighborhoods offer a balance of current income and upside potential, especially in buildings with below-market rents due to long-term RSO tenants.
South LA and emerging markets like South LA, parts of the San Fernando Valley, Inglewood (pre-development areas), and other transitional neighborhoods can trade at 5% to 6% or higher. Higher cap rates here reflect a combination of perceived risk, lower absolute rents, and in some cases significant value-add opportunity.
Keep in mind these are general ranges. Individual deals can fall well outside these bands based on building condition, unit mix, lease-up status, and seller motivation.
This is the single most important thing to understand about cap rates in LA: the Rent Stabilization Ordinance creates a disconnect between current income and potential income that doesn't exist in most other markets.
A 12-unit building in Koreatown with long-term tenants paying $1,200 per month might show a 4% cap rate based on current rents. But if market rent for those units is $2,000 per month, there's $115,000 in annual gross rent upside sitting in that building. Under Costa-Hawkins, every time a tenant voluntarily vacates, you can reset that unit to market rent.
This is what brokers call loss-to-lease, and it's the reason some of the best deals in LA look mediocre on a current cap rate basis. Sophisticated buyers underwrite to a blended cap rate that accounts for expected turnover and rent resets over a 3 to 5 year hold period.
If you're only looking at the going-in cap rate, you're missing the story on most RSO-regulated buildings.
The Gross Rent Multiplier is the other metric you'll hear constantly in LA apartment transactions. GRM equals the purchase price divided by gross annual rent. A building selling for $4 million with $300,000 in annual gross rent has a GRM of 13.3x.
GRM is popular because it's fast and easy to calculate. You can screen dozens of deals in minutes using GRM alone. But it has a major blind spot: it completely ignores operating expenses.
Two buildings with identical GRMs can have dramatically different cap rates. A newer building with low maintenance costs and a Prop 13 protected tax basis might cap at 5%, while an older building with deferred maintenance, a recent reassessment, and high insurance premiums might cap at 3.5% despite the same GRM.
My recommendation: use GRM for initial deal screening, then switch to cap rate analysis for anything you're serious about. And for RSO buildings, layer in loss-to-lease analysis on top of both.
Cap rates don't exist in a vacuum. They move based on macroeconomic factors and local market dynamics.
Interest rates are the biggest driver. When borrowing costs drop, buyers can pay more for the same NOI stream, which pushes cap rates down. The inverse is also true. The rate environment in 2023 and 2024 pushed LA cap rates up by 50 to 100 basis points compared to the ultra-low rate era of 2020 to 2021.
Inventory and competition play a huge role in LA specifically. When there are fewer buildings on the market, buyers compete harder and accept lower returns. LA's apartment inventory is chronically tight because owners tend to hold long-term, especially with the tax benefits of depreciation and 1031 exchanges.
Rent growth expectations factor into buyer psychology. If investors believe rents will grow 5% annually, they'll accept a lower going-in cap rate because their yield improves over the hold period. LA's structural housing shortage supports this thesis, but RSO annual allowable increases (typically 3 to 4%) cap the upside for occupied units.
Building condition and age affect cap rates at the individual property level. A fully renovated 1960s building with updated systems, new roofing, and modern unit finishes will trade at a tighter cap than a deferred-maintenance building of the same vintage, even in the same neighborhood.
After years of brokering apartment deals in LA, certain patterns keep repeating among less experienced buyers and sellers.
Using asking price cap rates as market data. Listing cap rates are aspirational. What matters is where deals actually close. I track closed transaction data across LA submarkets specifically so my clients are working with real numbers, not wishful thinking.
Ignoring expense ratios. A building with a 4.5% cap and a 35% expense ratio is a very different asset than one with a 4.5% cap and a 55% expense ratio. The first building is efficient and well-maintained. The second might be hiding deferred maintenance or heading toward a major capital expense.
Treating cap rates as returns. Your actual return depends on leverage, capital improvements, rent growth, and exit timing. A 4% cap rate deal with 65% LTV at a 5.5% interest rate looks very different in year one than in year five after multiple rent resets.
Comparing across asset classes. Apartment building cap rates in LA don't compare directly to retail, office, or industrial. Each asset class has its own risk profile, liquidity characteristics, and investor base. A 5% cap on an apartment building is not the same value proposition as a 5% cap on a strip mall.
When I'm working with a buyer, I build a full underwriting model that goes beyond the cap rate. We look at current cap rate based on actual trailing 12-month income, pro forma cap rate after accounting for realistic rent resets over 3 to 5 years, price per unit compared to recent comps in the submarket, GRM as a sanity check against the broader market, and cash-on-cash return based on their actual financing terms.
For sellers, I position pricing based on where comparable buildings have actually traded, not where owners wish they'd traded. The most effective pricing strategy in LA right now is to price at or slightly below market cap rates to generate competitive interest, which often results in offers above asking.
The multifamily market in LA rewards investors who understand the nuance behind the numbers. If you're evaluating a deal or thinking about selling, I'm happy to walk through the analysis with you. That's what I do every day at The Group CRE.
As of early 2026, LA apartment cap rates generally range from 3.5% to 6%. Prime Westside locations like Beverly Hills, Century City, and Santa Monica trade at the lowest caps (3.5-4.5%). Mid-city areas like Koreatown, Hollywood, and Silver Lake typically see 4-5%. South LA, the Valley, and more emerging submarkets can trade at 5-6% or higher. These ranges shift based on building condition, unit count, RSO status, and rent upside.
Both, but for different reasons. Cap rate (Net Operating Income / Purchase Price) accounts for operating expenses and gives you a truer picture of return. GRM (Gross Rent Multiplier = Price / Gross Annual Rent) is a quicker screening tool but ignores expenses entirely. In LA's rent-controlled market, two buildings with identical GRMs can have wildly different cap rates depending on property taxes, insurance, and deferred maintenance. Use GRM for initial filtering and cap rate for actual underwriting.